Red Hat Blog를 보다가 관심 가는 글이 보여서 AI번역+약간 교정해 보았습니다.
출처: https://developers.redhat.com/articles/2025/10/16/profiling-vllm-inference-server-gpu-acceleration-rhel
대규모 언어 모델(LLM)의 성능 특성을 이해하는 것은 최적화에 매우 중요합니다. vLLM 및 LLM 인프라를 처음 접하는 사람들에게는 성능 프로파일링이 어렵게 느껴질 수 있습니다. 하지만 플레임 그래프와 같은 도구는 실행 흐름을 시각화하고 병목 현상을 파악하는 데 있어 직관적이고 강력한 시작점을 제공합니다.
이 게시물은 NVIDIA GPU가 장착된 Red Hat Enterprise Linux (RHEL) 시스템 에서 vLLM 추론 서버를 프로파일링하는 방법에 대한 포괄적인 가이드입니다 . 공식 vLLM 프로파일링 문서를 참고하여 특정 환경에 맞게 단계를 조정합니다.
이 과정은 세 가지 주요 단계로 구성됩니다.
- 환경 설정 : 필요한 NVIDIA 드라이버와 컨테이너 툴킷으로 RHEL 서버를 구성합니다.
- PyTorch 프로파일러를 사용한 기본 프로파일링 : 내장된 PyTorch 프로파일러를 사용하여 vLLM 서버를 실행하여 추론 요청의 추적을 캡처합니다.
- NVIDIA Nsight 시스템을 활용한 고급 프로파일링 : NVIDIA의 고급 프로파일링 도구를 사용하여 맞춤형 컨테이너 이미지를 구축하여 더욱 심층적인 GPU 통찰력을 얻으세요.
1부: 환경 구성
vLLM 프로파일링을 시작하기 전에 먼저 RHEL 서버가 GPU 가속 컨테이너를 지원하도록 준비해야 합니다.
1.1단계: NVIDIA 드라이버 설치
먼저, OS가 GPU 하드웨어와 통신하는 데 필수적인 NVIDIA 드라이버를 설치합니다.
# Install matching kernel development packages, which are required for building the driver modules
# https://docs.nvidia.com/datacenter/tesla/driver-installation-guide/index.html#rhel-installation-network
dnf install -y kernel-devel-matched kernel-headers
# Enable the CodeReady Builder (CRB) repository to access additional development packages
dnf config-manager --set-enabled crb
# Define variables for the distribution and architecture
distro=rhel9
arch=x86_64
# Add the NVIDIA CUDA repository to the system's package manager
dnf config-manager --add-repo https://developer.download.nvidia.com/compute/cuda/repos/$distro/$arch/cuda-$distro.repo
# Clear the package manager cache
dnf clean expire-cache
# Enable the open-source, DKMS-based NVIDIA driver module
dnf module enable -y nvidia-driver:open-dkms
# As an alternative, you could use: dnf module enable nvidia-driver:latest-dkms
# Install the NVIDIA open-source driver package
dnf install -y nvidia-open
# To uninstall, you would run: dnf remove -y nvidia-open
# For proprietary drivers, you might install: dnf install cuda-drivers
1.2단계: NVIDIA Container Toolkit 설치
NVIDIA 컨테이너 툴킷을 사용하면 컨테이너가 호스트의 GPU에 액세스할 수 있습니다. Podman에서 GPU 지원을 활성화하기 위해 이 툴킷을 설치하겠습니다.
# Add the NVIDIA Container Toolkit repository
# https://docs.nvidia.com/datacenter/cloud-native/container-toolkit/latest/install-guide.html
curl -s -L https://nvidia.github.io/libnvidia-container/stable/rpm/nvidia-container-toolkit.repo | \
  sudo tee /etc/yum.repos.d/nvidia-container-toolkit.repo
# Install a specific version of the toolkit components for stability
export NVIDIA_CONTAINER_TOOLKIT_VERSION=1.17.8-1
sudo dnf install -y \
      nvidia-container-toolkit-${NVIDIA_CONTAINER_TOOLKIT_VERSION} \
      nvidia-container-toolkit-base-${NVIDIA_CONTAINER_TOOLKIT_VERSION} \
      libnvidia-container-tools-${NVIDIA_CONTAINER_TOOLKIT_VERSION} \
      libnvidia-container1-${NVIDIA_CONTAINER_TOOLKIT_VERSION}
# Generate the CDI specification file, which allows container runtimes to discover the GPU devices
sudo nvidia-ctk cdi generate --output=/etc/cdi/nvidia.yaml
# List the available CDI devices to confirm the setup
nvidia-ctk cdi list
# Expected output:
# INFO[0000] Found 3 CDI devices
# nvidia.com/gpu=0
# nvidia.com/gpu=GPU-7e22d269-01f7-77c4-be2c-18969b4eec98
# nvidia.com/gpu=all
1.3단계: 컨테이너에서 GPU 액세스 확인
이제 테스트 컨테이너를 실행하여 GPU에 성공적으로 액세스할 수 있는지 확인해 보겠습니다.
# Allow containers to use devices by setting the appropriate SELinux boolean
sudo setsebool -P container_use_devices 1
# Run a CUDA-based container and execute nvidia-smi to verify GPU access
podman run --rm -it \
--security-opt=label=disable \
--device nvidia.com/gpu=all \
nvcr.io/nvidia/cuda:12.4.1-base-ubi9 \
nvidia-smi
# The output should display the GPU status, confirming the setup is correct.
# Tue Sep 16 15:40:13 2025
# +-----------------------------------------------------------------------------------------+
# | NVIDIA-SMI 580.82.07              Driver Version: 580.82.07      CUDA Version: 13.0     |
# +-----------------------------------------+------------------------+----------------------+
# | GPU  Name                 Persistence-M | Bus-Id          Disp.A | Volatile Uncorr. ECC |
# | Fan  Temp   Perf          Pwr:Usage/Cap |           Memory-Usage | GPU-Util  Compute M. |
# |                                         |                        |               MIG M. |
# |=========================================+========================+======================|
# |   0  NVIDIA L4                      Off |   00000000:31:00.0 Off |                    0 |
# | N/A   29C    P8             12W /   72W |       0MiB /  23034MiB |      0%      Default |
# |                                         |                        |                  N/A |
# +-----------------------------------------+------------------------+----------------------+
# ...
2부: PyTorch 프로파일러를 사용한 기본 프로파일링
환경이 준비되었으므로 이제 vLLM 서버를 실행하고 기본 프로파일링 세션을 수행할 수 있습니다.
2.1단계: 초기 추론 테스트
프로파일링을 시작하기 전에 vLLM 추론 서버가 환경에서 정상적으로 작동하는지 확인하는 것이 중요합니다. 이 단계를 통해 나중에 발생하는 문제가 기본 설정이 아닌 프로파일링과 관련된 문제인지 확인할 수 있습니다.
vLLM 컨테이너를 실행하고 간단한 추론 요청을 전송하여 작동 여부를 확인해 보겠습니다. Red Hat AI Inference Server 배포에 대한 자세한 내용은 공식 문서를 참조하십시오.
# Navigate to a directory for storing container data
mkdir -p rhaiis-cache
chmod g+rwX rhaiis-cache
# Create an environment file for your Hugging Face token
echo "export HF_TOKEN=<your_HF_token>" > private.env
source private.env
# Run the vLLM container, mapping ports and volumes.
podman run --rm -it \
--device nvidia.com/gpu=all \
--security-opt=label=disable \
--shm-size=8g -p 8000:8000 \
--userns=keep-id:uid=1001 \
--env "HUGGING_FACE_HUB_TOKEN=$HF_TOKEN" \
--env "HF_HUB_OFFLINE=0" \
--env "VLLM_NO_USAGE_STATS=1" \
-v ./rhaiis-cache:/home/vllm:Z \
registry.redhat.io/rhaiis/vllm-cuda-rhel9:3.2.1 \
--model RedHatAI/Qwen3-8B-FP8-dynamic \
--tensor-parallel-size 1
서버가 실행 중인 상태에서 새 터미널을 열어 테스트 추론 요청을 전송하세요. 이 초기 확인에서는 출력을 토큰 50개로 제한하겠습니다.
# In a new terminal, send a test request to the server.
# We limit the output to 50 tokens for this initial test.
curl -X POST -H "Content-Type: application/json" -d '{
"prompt": "What is the capital of France?",
"max_tokens": 50
}' http://127.0.0.1:8000/v1/completions | jq
# A successful response confirms the server is working.
# {
#   "id": "cmpl-206df592b55f47faaa28e4183f6f9f55",
#   ...
#   "usage": {
#     "prompt_tokens": 7,
#     "total_tokens": 57,
#     "completion_tokens": 50
#   }
# }
2.2단계: 프로파일링 모드에서 실행
이제 서버가 작동하는지 확인했으므로 PyTorch 프로파일러를 활성화하여 다시 시작할 수 있습니다. vLLM은 환경 변수를 설정하여 프로파일러를 활성화하는 편리한 방법을 제공합니다.
# Run the container again, this time setting the VLLM_TORCH_PROFILER_DIR environment variable.
# This instructs vLLM to save the resulting trace files to the specified directory inside the container.
# For more granular analysis, vLLM supports additional profiler variables to capture shapes, memory usage, stack traces, and FLOPs.
# --env "VLLM_TORCH_PROFILER_RECORD_SHAPES=1"
# --env "VLLM_TORCH_PROFILER_WITH_PROFILE_MEMORY=1"
# --env "VLLM_TORCH_PROFILER_WITH_STACK=1"
# --env "VLLM_TORCH_PROFILER_WITH_FLOPS=1"
podman run --rm -it \
--device nvidia.com/gpu=all \
--security-opt=label=disable \
--shm-size=8g -p 8000:8000 \
--userns=keep-id:uid=1001 \
--env "HUGGING_FACE_HUB_TOKEN=$HF_TOKEN" \
--env "HF_HUB_OFFLINE=0" \
--env "VLLM_NO_USAGE_STATS=1" \
--env "VLLM_TORCH_PROFILER_DIR=/home/vllm" \
-v ./rhaiis-cache:/home/vllm:Z \
registry.redhat.io/rhaiis/vllm-cuda-rhel9:3.2.1 \
--model RedHatAI/Qwen3-8B-FP8-dynamic \
--tensor-parallel-size 1
두 번째 터미널에서는 먼저 프로파일링을 시작하는 명령을 보냅니다.
# In Terminal 2, send the command to start profiling.
curl -X POST http://localhost:8000/start_profile
그런 다음 토큰 수를 낮게(10) 유지하여 결과 추적을 쉽게 분석할 수 있도록 추론 요청을 보냅니다.
# Send an inference request. We use a small number of tokens (10)
# to make the resulting trace easier to analyze.
curl -X POST -H "Content-Type: application/json" -d '{
"prompt": "What is the capital of France?",
"max_tokens": 10
}' http://127.0.0.1:8000/v1/completions | jq
요청이 완료되면 프로파일러를 중지하기 위해 또 다른 명령을 보냅니다.
# send the command to stop profiling.
curl -X POST http://localhost:8000/stop_profile
이 시점에서 추적 파일이 생성되어 캐시 디렉토리에서 찾을 수 있습니다.
# Check the cache directory for the generated trace file.
ls -hla rhaiis-cache
# total 5.5M
# drwxrwxr-x. 4 root root   92 Sep 17 03:59 .
# ...
# -rw-r--r--. 1 2000 root 5.5M Sep 17 03:59 299a41dbe2d9_111.1758081594179965003.pt.trace.json.gz
2.3단계: 프로필 추적 분석
생성된 .pt.trace.json.gz 파일은 Perfetto UI와 같은 추적 뷰어를 사용하여 분석할 수 있습니다 .
추적을 열면 다음과 같은 뚜렷한 패턴을 관찰할 수 있습니다.
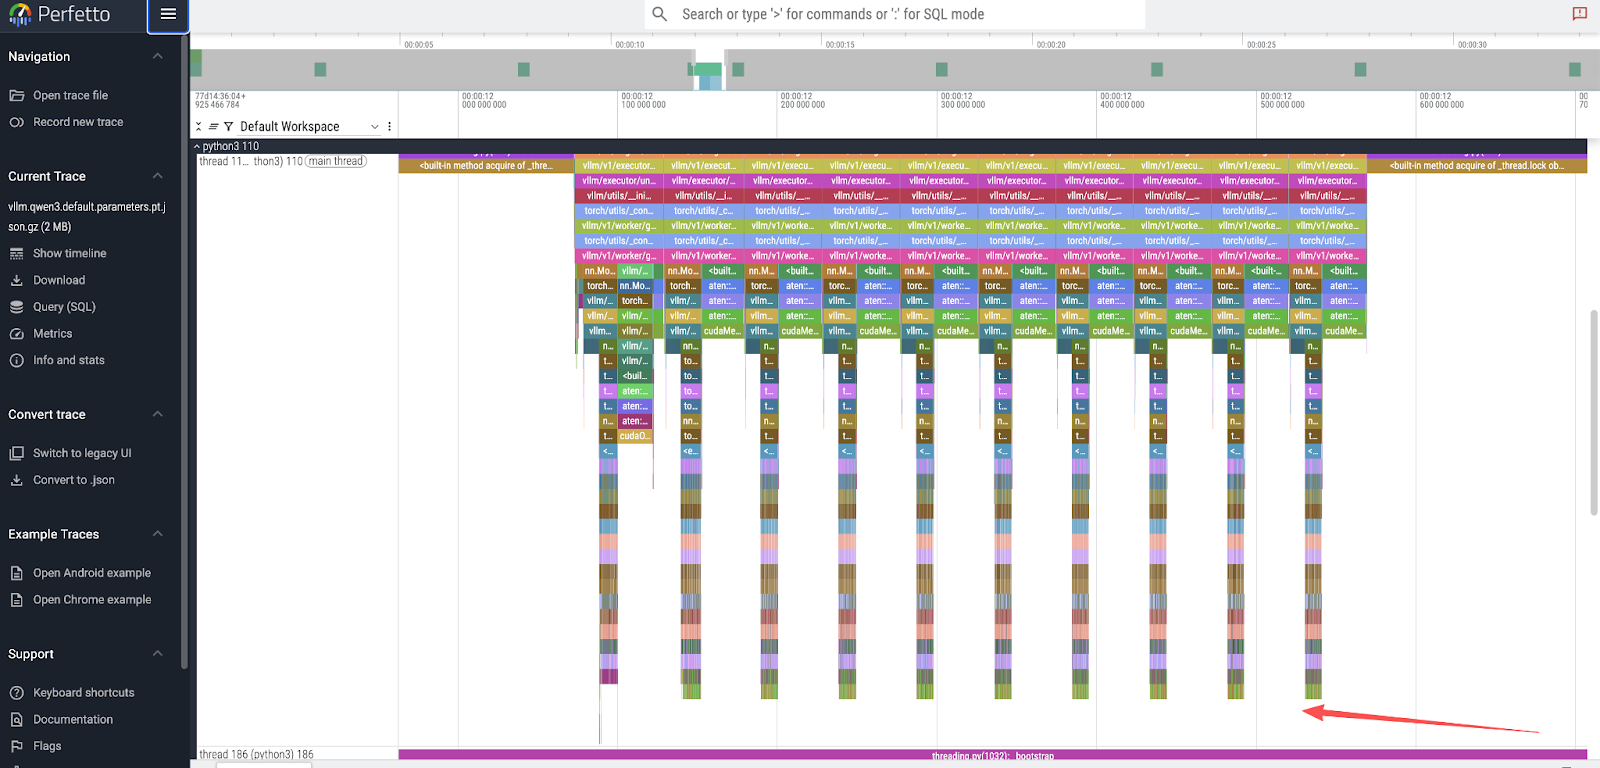
- 토큰 생성 피크 : 최상위 뷰에는
max_tokens: 10요청한 값과 직접적으로 일치하는 10개의 개별 피크가 표시됩니다. 그림 1을 참조하세요.
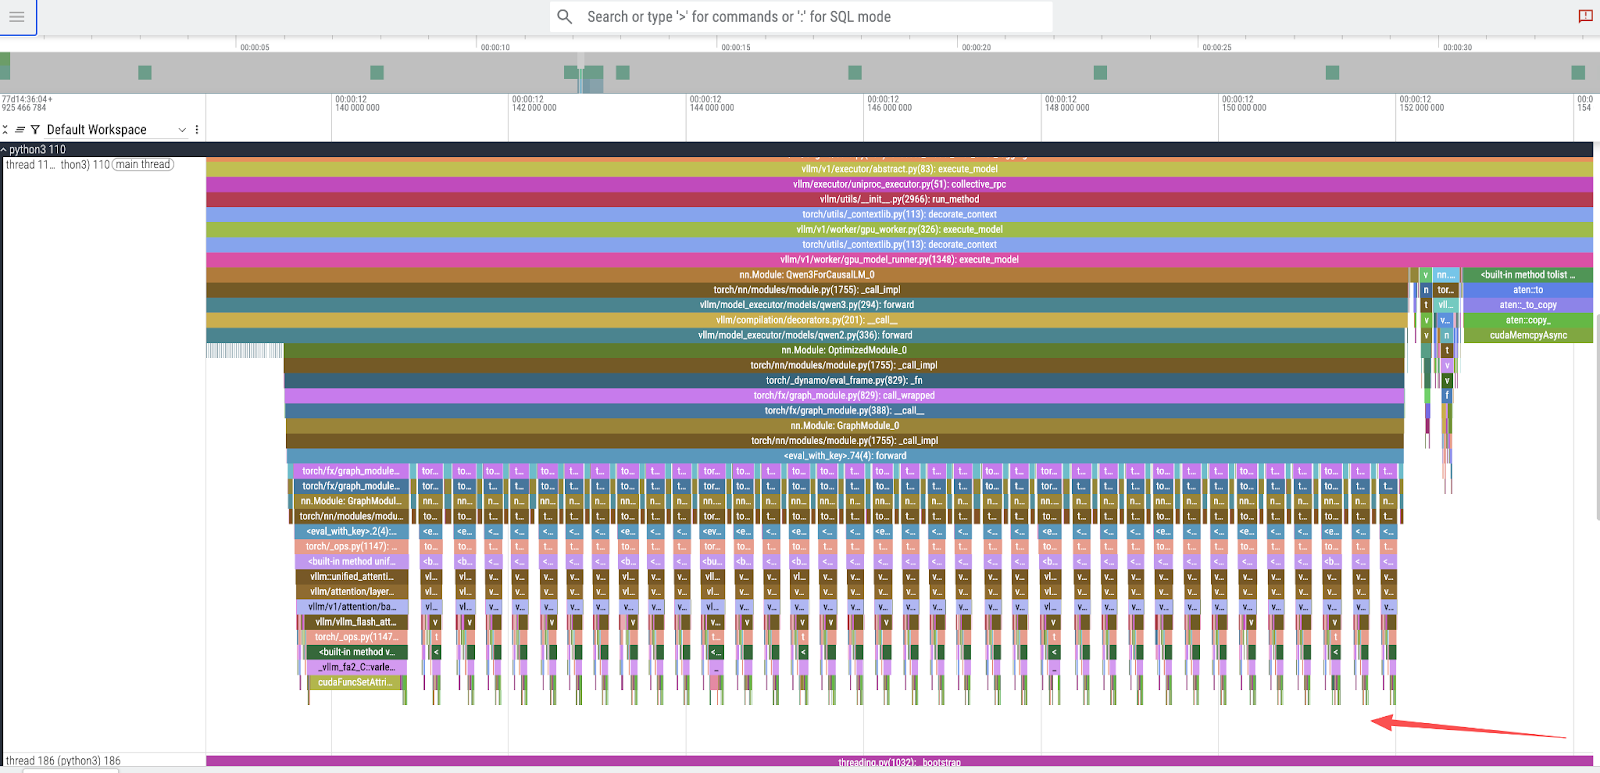
- 모델 계층 실행 : 단일 토큰 피크를 확대하면 36개의 더 작고 연속적인 피크가 나타납니다. 이는 Qwen3-8B 모델의 36개 디코더 계층에 해당합니다. 그림 2를 참조하세요.
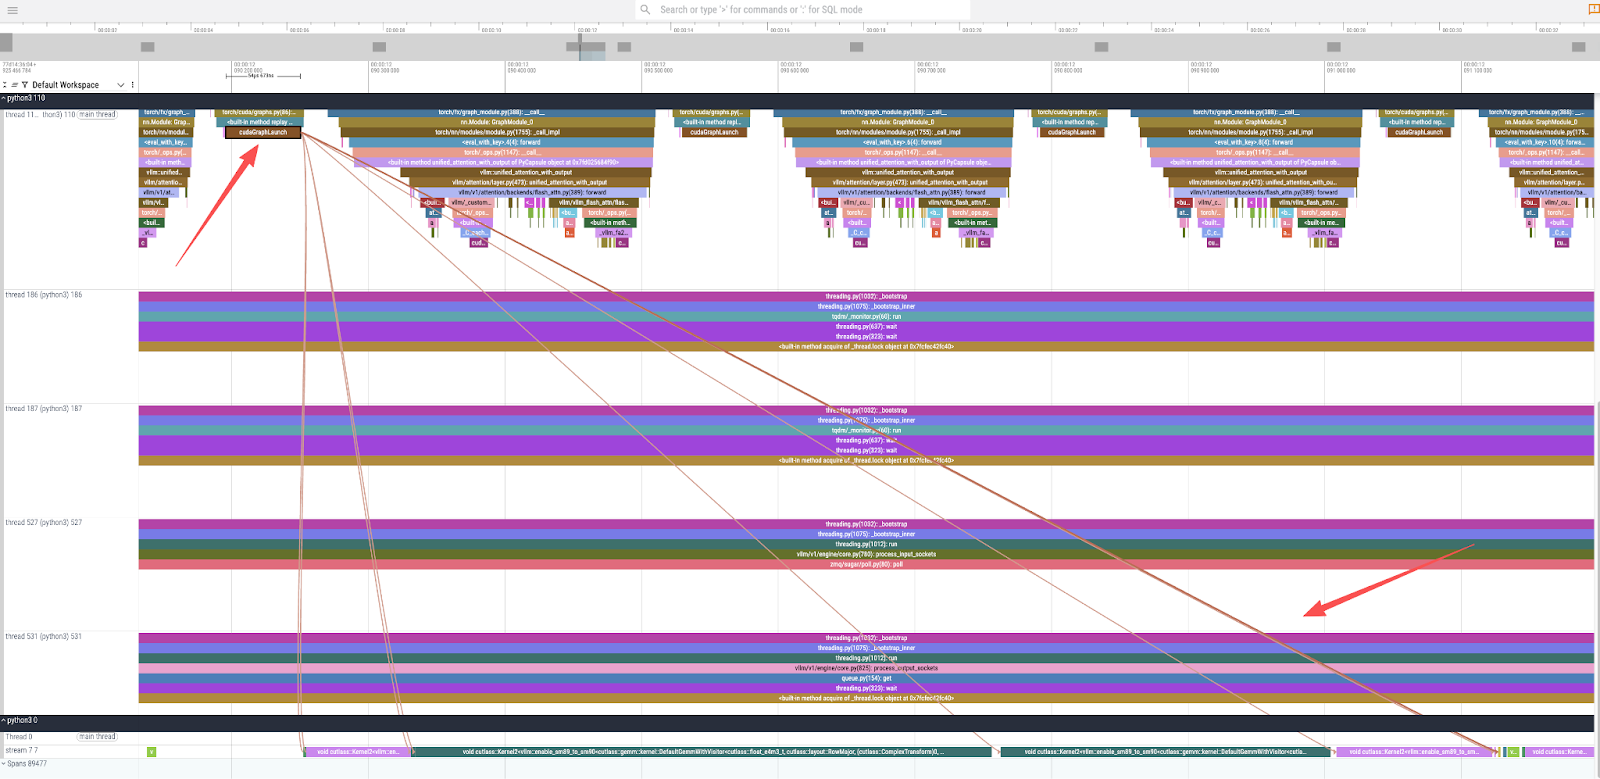
- CUDA 커널 실행 : 트레이스를 더 자세히 확대하고
cudaGraphLaunch를 선택하면 기본 GPU 연산을 살펴볼 수 있습니다(그림 3). 이를 통해 실제 계산을 담당하는 여러 CUDA 커널이 호출되었음을 알 수 있으며, 여기에는 변압기 모델의 기본 연산인 일반 행렬 곱셈(GEMM)에 고도로 최적화된cutlass::gemm커널도 포함됩니다.
코드 경로를 이해하기 위해 vLLM 소스를 살펴볼 수 있습니다. 추적 결과는 qwen3 forward 함수 호출을 보여줍니다. 소스 코드를 살펴보면 Qwen3Model은 Qwen2Model을 직접 상속합니다.
출처 : vllm/model_executor/models/qwen3.py
class Qwen3Model(Qwen2Model):
    ...
Qwen2Model의 forward 메서드는 Qwen2DecoderLayer의 인스턴스인 모델의 레이어를 반복합니다.
출처 : vllm/model_executor/models/qwen2.py
# ...
        for idx, layer in enumerate(
                islice(self.layers, self.start_layer, self.end_layer)):
            # ...
            hidden_states, residual = layer(positions, hidden_states, residual)
# ...
마지막으로, Qwen2DecoderLayer의 순방향 방법은 변환기 블록의 표준 구성 요소인 계층 정규화, 자기 주의 및 다층 퍼셉트론(MLP)을 보여줍니다.
출처 : vllm/model_executor/models/qwen2.py
# ...
    def forward(
        self,
        positions: torch.Tensor,
        hidden_states: torch.Tensor,
        residual: Optional[torch.Tensor],
    ) -> tuple[torch.Tensor, torch.Tensor]:
        # Self Attention
        # ...
        hidden_states = self.self_attn(...)
        # Fully Connected
        # ...
        hidden_states = self.mlp(hidden_states)
        return hidden_states, residual
# ...
이 분석을 통해 플레임 그래프가 모델의 아키텍처와 실행 흐름을 정확하게 표현하고 있음을 확인할 수 있습니다.
3부: NVIDIA Nsight 시스템을 사용한 고급 프로파일링
더욱 자세한 하드웨어 수준 보기를 위해 NVIDIA Nsight Systems를 사용할 수 있습니다. 이를 위해서는 Nsight CLI 도구를 사용하여 사용자 지정 컨테이너 이미지를 구축해야 합니다.
3.1단계: Nsight 지원 컨테이너 빌드
새 이미지를 빌드하기 위해 Containerfile을 만듭니다.
# nsys.dockerfile
FROM registry.redhat.io/rhaiis/vllm-cuda-rhel9:3.2.1
USER root
# Add NVIDIA developer repository for Nsight Systems
RUN rpm --import https://developer.download.nvidia.com/compute/cuda/repos/ubuntu1804/x86_64/7fa2af80.pub
RUN microdnf install -y dnf && microdnf clean all
RUN microdnf install -y dnf-plugins-core && microdnf clean all
RUN dnf config-manager --add-repo "https://developer.download.nvidia.com/devtools/repos/rhel$(source /etc/os-release; echo ${VERSION_ID%%.*})/$(rpm --eval '%{_arch}' | sed s/aarch/arm/)/"
# Install the Nsight Systems CLI
RUN dnf install -y nsight-systems-cli
USER 2000
# Set the entrypoint to automatically wrap the vLLM server with nsys profile
ENTRYPOINT ["nsys", "profile", "-o", "/home/vllm/report.nsys-rep", "--trace-fork-before-exec=true", "--cuda-graph-trace=node", "python3", "-m", "vllm.entrypoints.openai.api_server"]
이미지를 빌드하고 푸시합니다.
podman build -t quay.io/wangzheng422/qimgs:vllm-cuda-rhel9-3.2.1-nsys-2025.09.17-v01 -f nsys.dockerfile .
podman push quay.io/wangzheng422/qimgs:vllm-cuda-rhel9-3.2.1-nsys-2025.09.17-v01
3.2단계: Nsight 보고서 생성
사용자 지정 컨테이너 이미지가 준비되었으므로 이제 프로파일링을 실행할 수 있습니다. 컨테이너는 nsys 프로파일러 아래에서 vLLM 서버를 자동으로 시작하도록 구성되어 있으므로, 컨테이너가 시작되는 즉시 프로파일링 프로세스가 시작됩니다.
먼저, 사용자 지정 컨테이너를 실행합니다. 그러면 vLLM 서버가 프로파일링 모드로 시작됩니다.
# Launch the custom container. The ENTRYPOINT is configured to wrap the vLLM
# server command with `nsys profile`, so profiling starts automatically.
podman run --rm -it \
--device nvidia.com/gpu=all \
--security-opt=label=disable \
--shm-size=8g -p 8000:8000 \
--userns=keep-id:uid=1001 \
--env "HUGGING_FACE_HUB_TOKEN=$HF_TOKEN" \
--env "HF_HUB_OFFLINE=0" \
--env "VLLM_NO_USAGE_STATS=1" \
-v ./rhaiis-cache:/home/vllm:Z \
quay.io/wangzheng422/qimgs:vllm-cuda-rhel9-3.2.1-nsys-2025.09.17-v01 \
--model RedHatAI/Qwen3-8B-FP8-dynamic \
--tensor-parallel-size 1
서버가 실행되는 동안 새 터미널을 열고 추론 요청을 전송하세요. 이 동작은 프로파일링하려는 특정 코드 경로를 트리거합니다.
# In a new terminal, send an inference request to trigger the profiled code path.
# This ensures that the Nsight trace captures the GPU activity during model execution.
curl -X POST -H "Content-Type: application/json" -d '{
"prompt": "What is the capital of France?",
"max_tokens": 10
}' http://127.0.0.1:8000/v1/completions | jq
추론 요청이 완료되면 첫 번째 터미널에서 Ctrl+C를 눌러 컨테이너를 중지할 수 있습니다 . 종료 시 Nsight Systems는 수집된 데이터를 처리하고 최종 추적 파일을 컨테이너 내부의 지정된 경로에 저장합니다.
# Press Ctrl+C in the container's terminal. Nsight will gracefully shut down
# and save the profiling report.
# ^CINFO 09-17 04:14:28 [launcher.py:101] Shutting down FastAPI HTTP server.
# ...
# Generating '/tmp/nsys-report-b99f.qdstrm'
# [1/1] [========================100%] report.nsys-rep
# Generated:
#         /home/vllm/report.nsys-rep
마지막으로, 호스트 시스템의 마운트된 rhaiis-cache 디렉토리에 보고서 파일이 생성되었는지 확인하세요.
# Verify that the report file was created in the host directory.
ls -hla rhaiis-cache/
# total 17M
# ...
# -rw-rw-r--. 1 2000 root 17M Sep 17 04:14 report.nsys-rep
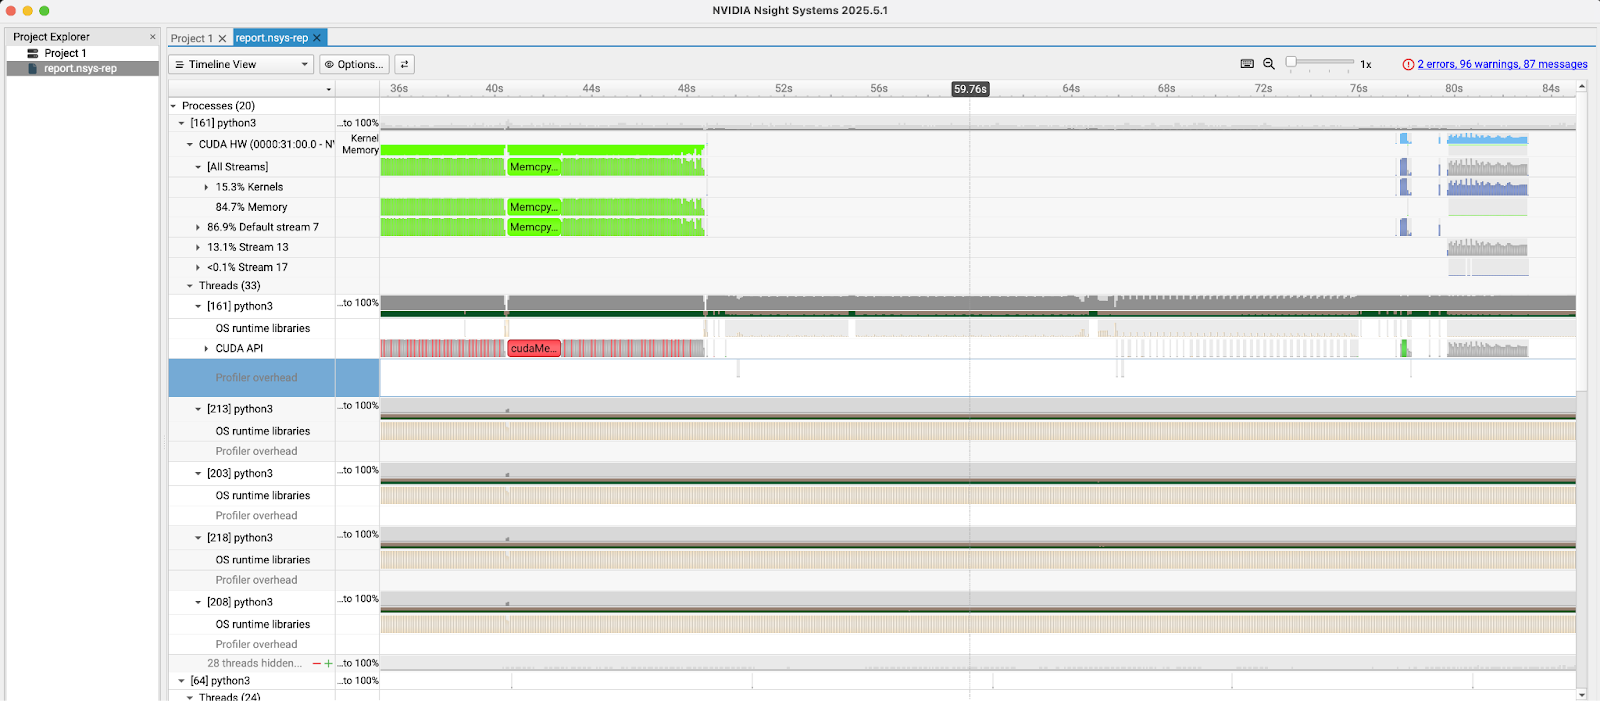
3.3단계: Nsight 보고서 분석
rhaiis-cache 디렉토리에서 report.nsys-rep 파일을 로컬 컴퓨터로 복사하고 NVIDIA Nsight 시스템 GUI로 엽니다. 그림 4에서 볼 수 있듯이, 이 도구는 CUDA 커널 실행, 메모리 전송, API 호출 등 CPU 및 GPU 활동에 대한 자세한 타임라인을 제공하여 심층적인 성능 분석을 가능하게 합니다.
프로파일링 데이터의 오프라인 분석
GPU 환경을 설정하거나 프로파일링 프로세스를 직접 실행하지 않고 프로파일링 결과를 살펴보고 싶은 사용자를 위해 생성된 추적 파일을 제공합니다. 이 파일을 다운로드하고 해당 도구(PyTorch 추적용 Perfetto UI 및 Nsight 보고서용 NVIDIA Nsight Systems GUI)를 사용하여 직접 분석을 수행할 수 있습니다.
- PyTorch 프로파일링 결과 : vllm.qwen3.default.parameters.pt.json.gz
- NVIDIA Nsight 결과 : report.nsys-rep.zip
결론
이 가이드를 통해 GPU 지원 RHEL 환경을 성공적으로 구성하고, PyTorch 프로파일러를 사용하여 기본 성능 추적을 수행하고, NVIDIA Nsight 시스템을 사용하여 고급 프로파일링 워크플로를 설정했습니다.
- PyTorch 프로파일러는 고수준 실행 흐름을 빠르게 이해하고 이를 모델 아키텍처와 연관시키는 데 매우 유용합니다.
- NVIDIA Nsight Systems는 CUDA 커널과 메모리 액세스 패턴의 고급 최적화에 필수적인 훨씬 더 심층적이고 하드웨어 중심적인 뷰를 제공합니다.
이러한 도구를 활용하면 개발자와 MLOps 엔지니어는 vLLM 성능에 대한 중요한 통찰력을 얻을 수 있으며, 이를 통해 타겟 최적화와 보다 효율적인 LLM 제공을 위한 길을 열 수 있습니다.

